Your finance and billing systems contain a treasure trove of information about your customers, suppliers, and your business health.
Are you unlocking their potential to derive new knowledge about your company?
In this short article I explore the types of insight that can be gained from the data in your finance system. We use the cloud-based software as a service (SaaS) product, KashFlow, at All My Systems. It provides an easy to use solution for accounting and bookkeeping and meets our current needs.
 Alongside the usual company reports (Profit and loss, balance sheet), I’ve picked out several other reports below which provide us with valuable insight about our business:
- Monthly income – a bar chart which summarises by month the total amount from invoices due in that month
- Income by customer – a pie chart run between two dates providing total income by customer
- Income by source – a pie chart run between two dates showing your sources of income
- Income by product – a pie chart run between two dates totaling each products income
- Expenditure by supplier – a pie chart run between two dates showing your expenditure by supplier
Individual reports are useful, but running multiple reports together helps you spot patterns, trends or problems in your data. One way to achieve this is to print the reports off and lay them next to each other on a table to spot these patterns, trends or problems.
The way we do this at All My Systems is to create a dashboard of information using Excel. We combine these individual reports together into one master dashboard which helps us look at the whole picture, or a holistic view, of our business. We do this on a weekly basis to generate a one page, A4 company health report tailored to our business. It allows us to spot patterns, trends and problems with our data very quickly.
So, what types of insight do we gain from doing this?
- Occasionally we might uncover a source of income that hasn’t been assigned correctly. For example, if our referral marketing hasn’t been attributed to the customer correctly, then our picture of the value of spending our money on referral marketing would be inaccurate
- At a glance we can see the relationship between the total income from customers, the total income by product, and the total income by source. This triggers questions for us to explore further such as ‘Why have sales of new websites dropped?’
By far the most important reason for running these reports is the old adage, garbage in garbage out. Unless you frequently use the reports available in your systems, before you know it your data can get out of control and become inconsistent, especially with multiple people updating the same system.
By using reports to verify the output it allows you to check whether there is a data input problem. By keeping on top of reports in this way, it keeps your data consistent, and you can trust the reports when they are produced – it reduces the risk of saying “the reports from my system are rubbish” – which we often hear.
Dashboards – why do we use Excel?
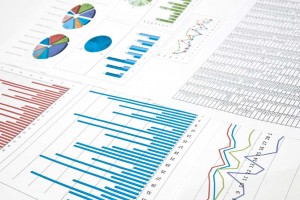 We input key data items from these reports into an Excel spreadsheet template which provides us with a dashboard of information about the health of our business.
“Oh no, you’re entering the data into an Excel spreadsheet?”
Absolutely!
Excel is an exceptionally powerful tool which many people only ever use about 5-10% of the features for. Microsoft continues to invest heavily in the continued development of Excel which forms a major component of their business intelligence (BI) and analytics strategy. In fact, it has had BI capabilities in it for over 7 years now, and with over 1 billion users worldwide, Microsoft are now promoting Excel as the go-to analytics tool for business.
We run the reports on a weekly basis, usually on a Friday. It takes 10 minutes in total to run the reports and input the data into a standard Excel template. The result is a professional dashboard which we use to easily monitor the weekly health of our business.
One example of a company dashboard can be seen over at Project Botticelli. There’s plenty of dashboard tutorials on YouTube as well, take 5 minutes out to see what can be achieved. I’ll cover more advanced dashboards in future articles.
Reporting in your business
Every business has different needs when it comes to reporting. If you have a low volume of customers with high transaction values then your reporting needs will be different to a business with thousands of customers spending £5 each.
Would this kind of meaningful business intelligence be useful for your business?